
What is an Average Percentage?
An average percentage calculates the central mean across multiple percentage figures. While simple averages work when sample sizes are identical, datasets with varying sample counts require a weighted average based on absolute volume to prevent statistical skewing.
Average Percentage Formulas:
How Does Average Percentage Calculator Work?
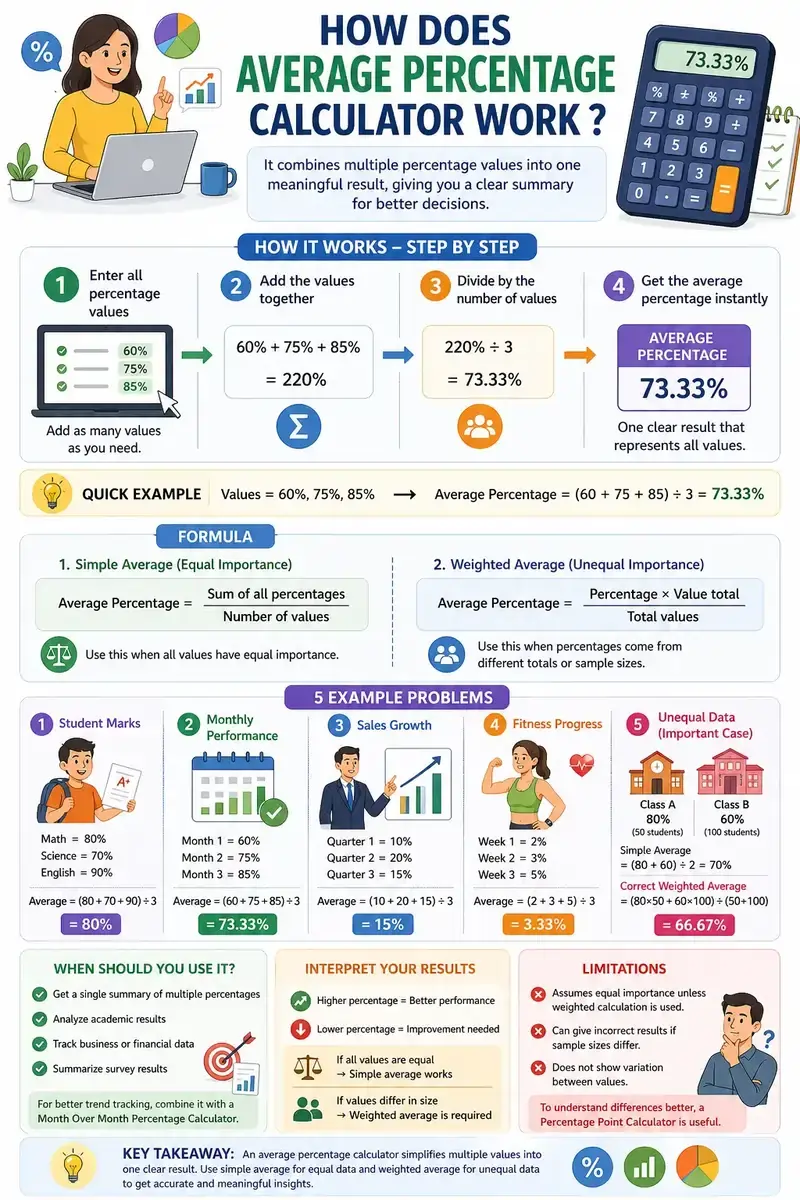
The Average Percentage Calculator evaluates lists of rates in three steps:
- Input Entry: Input your percentage values using dynamic input rows.
- Cumulative Summation: The algorithm sums all non-empty entries and counts valid numeric fields.
- Mean Derivation: Dividing total percentage sum by the total entry count produces the arithmetic mean.
All calculations run locally in your browser memory, keeping your financial numbers private.
5 Example Problems of Average Percentage
A student scores 78%, 85%, and 92% across three equally weighted semester tests.
Answer: 85.00% mean exam performance score
Four corporate divisions achieve cost reductions of 12%, 15%, 8%, and 13%.
Answer: 12.00% average departmental savings rate
A marketer records conversion rates of 3.2%, 4.0%, 3.8%, and 4.2% across four balanced ad cohorts.
Answer: 3.80% average campaign conversion rate
Three manufacturing shifts report quality pass rates of 98.5%, 97.2%, and 99.1%.
Answer: 98.27% mean assembly line inspection rate
Three balanced index funds deliver annual capital gains of 14%, 6%, and 10%.
Answer: 10.00% mean portfolio asset return
What Are Key Features, Benefits and Limitations of Average Percentage Calculator?
Key Features
- Dynamic input rows allowing calculation across any number of values.
- Summary breakdown showing entry count and aggregate sum.
- Real-time input clearing with instant keyboard enter support.
Practical Benefits
- Simplifies student grading calculations and GPA estimations.
- Quickly synthesizes multi-division enterprise efficiency reports.
- Evaluates balanced A/B testing percentage rates without math errors.
Technical Limitations
- Assumes equal weighting across all entries.
- Unequal sample sizes require separate weighted frequency calculations.
How to Interpret Your Average Percentage Results?
Interpreting average percentage figures requires assessing sample balance:
- Single Growth vs. Aggregate Means: While evaluating a single upward expansion is handled by our percentage increase calculator, operational reductions across cohorts are verified with our percentage decrease calculator.
- Measuring Absolute Point Spreads: When evaluating how far an individual score lands from the cohort mean, use our percentage point calculator.
- Sequential & Compounding Trends: Pair monthly average performance with our mom calculator, or evaluate compounding returns instead of arithmetic averages using our cumulative percentage calculator.
- Multi-Year Averages & Pacing: For tracking average annual trajectories over time, review our yoy percentage calculator, or assess quota completion with our percent to goal calculator.
- Reconstructing Missing Baseline Values: If back-calculating original totals from known average rates, rely on our reverse percentage calculator.
Frequently Asked Questions
Only if all sample sizes or total base counts are identical. When the underlying group totals differ in size, you must use a weighted average based on absolute counts.
Simpson's Paradox occurs when a trend appears in several different groups of data but disappears or reverses when the groups are combined, which happens when simple percentage averages are calculated without proper sample size weighting.
Multiply each percentage by its total base count, sum those products, and divide that total sum by the sum of all base counts.
Yes, if calculating average percentage changes, investment returns, or price shifts where negative rates represent net losses or decreases.